Offheaping the Read Path in Apache HBase: Part 2 of 2
by HBase Committers Anoop Sam John, Ramkrishna S Vasudevan, and Michael Stack
This is part two of a two part blog. Herein we compare before and after off heaping. See part one for preamble and detail on work done.
Performance Results
There were two parts to our performance measurement.
-
Using HBase’s built-in Performance Evaluation (PE) tool.
-
Using YCSB to measure the throughput.
The PE test was conducted on a single node machine. Table is created and loaded with 100 GB of data. Table has one CF and one column per row. Each cell value size is 1K. Configuration of the node :
System configuration
CPU : Intel(R) Xeon(R) CPU with 8 cores.
RAM : 150 GB
JDK : 1.8
HBase configuration
HBASE_HEAPSIZE = 9 GB HBASE_OFFHEAPSIZE = 105 GBhbase.bucketcache.ioengine offheap hfile.block.cache.size 0.2 hbase.bucketcache.size 104448
20% of the heap is allocated to the L1 cache (LRU cache). When L2 is enabled, L1 holds no data, just index and bloom filter blocks. 102 GB off heap space is allocated to the L2 cache (BucketCache)
Before performing the read tests, we have made sure that all data is loaded into BucketCache so there is no i/o. The read workloads of PE tool run with multiple threads. We considerthe average completion time for each of the threads to do the required reads.
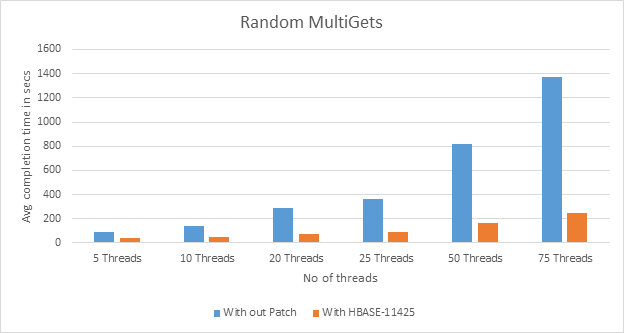
1. Each thread does 100 row multi get operations for 1000000 times. We can see that there is a 55 – 82 % reduction in average run time. See the graph below for the test for 5 to 75 threads reading. Y axis shows average completion time, in seconds, for one thread.
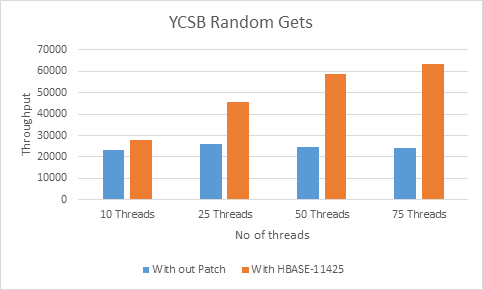
Here each thread is doing 100000000 row get and converting this to throughput numbers we can see
|
|
5 Threads |
10 Threads |
20 Threads |
25 Threads |
50 Threads |
75 Threads |
|
Throughput Without Patch |
5594092.638 |
7152564.19 |
7001330.25 |
6920798.38 |
6113142.03 |
5463246.92 |
|
Throughput With HBASE-11425 |
11353315.17 |
19782393.7 |
28477858.5 |
28216704.3 |
30229746.1 |
30647270.3 |
|
Throughput gain |
2x |
2.7x |
4x |
4x |
4.9x |
5.6x |
So without the patch case, at the 20 threads level, the system goes to peak load situation and throughput starts to fall off. But with HBASE-11425 this is not the case and even with 75 threads. It is mostly linear scaling with more loading. The major factor which helps us here is reduced GC activity.
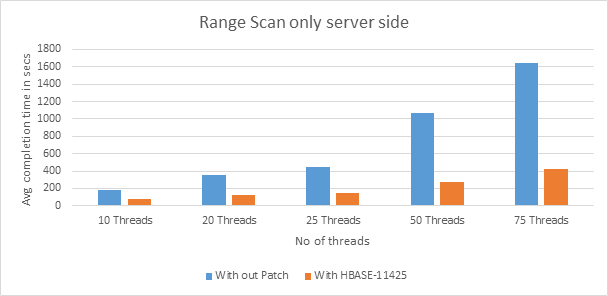
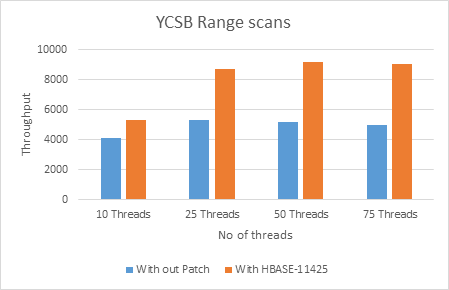
2. Each thread is doing a range scan of 10000 rows with filtering of all the data on the server side. The filtering is done to see the server side gain alone and avoid any impact of network and/or client app side bottleneck. Each thread is doing the scan operation 10000 times. We can see that there is 55 – 74 % reduction in average run time of each thread. See below the graph for the test for 5 to 75 threads reading. Y axis shows average completion time, in seconds, for one thread.
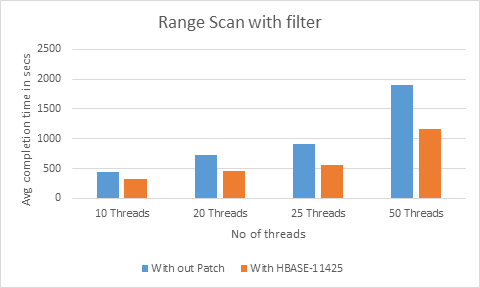
3. Another range scan test is performed with part of data returned back to client. The test will return 10% of total rows back to the client and the remaining rows are filtered out at the server. The below graph is for a test with 10, 20, 25 and 50 threads. Again Y axis gives the average thread completion time, in seconds. The gain is 28 – 39% latency.
The YCSB test is done in same cluster with 90 GB of data. We had similar system configuration and HBase configuration as for the PE tests.
The YCSB setup involves creating a table with a single column family with around 90 GB of data. There are 10 columns each with 100 bytes of data (each row having 1k of data). All the readings are taken after ensuring that the entire data set is in the BucketCache. The multi get test includes each thread doing 100 row gets and 5000000 such operations. Range scan does random range scans with 1000000 operations.
|
Threads |
With HBASE-11425(Ops/sec) |
Withoutpatch(Ops/sec) |
|
10 |
28045.53 |
23277.97 |
|
25 |
45767.99 |
25922.18 |
|
50 |
58904.03 |
24558.72 |
|
75 |
63280.86 |
24316.74 |
|
Threads |
With HBASE-11425(Ops/Sec) |
Withoutpatch(Ops/sec) |
|
10 |
5332.451701 |
4139.416 |
|
25 |
8685.456204 |
5340.796 |
|
50 |
9180.235565 |
5149 |
|
75 |
9019.192842 |
4981.8 |
For multi get there is 20 – 160 % throughput gain whereas for range scan it is 20 - 80%.
With HBASE-11425 we can see there is linear throughput increase with more threads whereas old code starts performing badly when more threads (See when 50 and 75 threads)
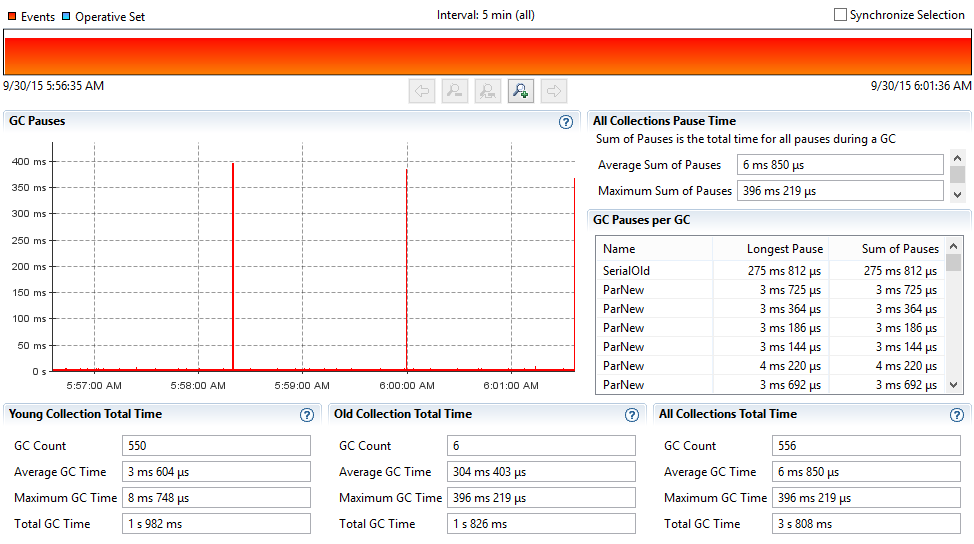
GC graphs
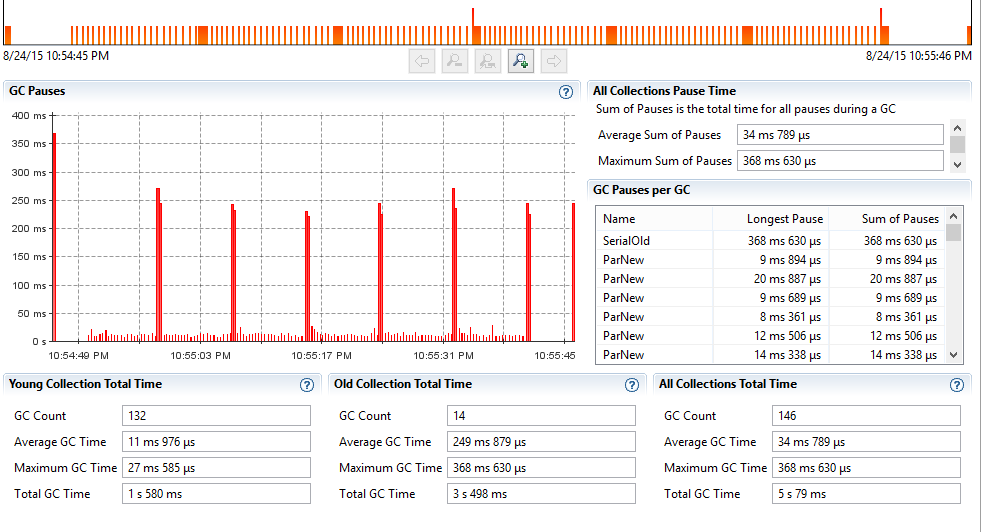
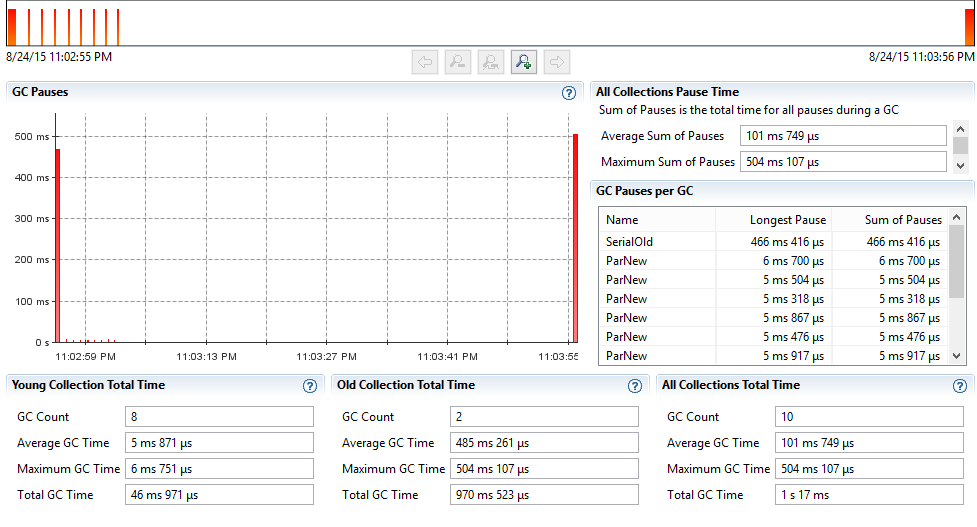
With HBASE-11425, we serve data directly from the off heap cache rather than copy each of the blocks on heap for each of the reads. So we should be doing much better with respect to GC on the RegionServer side. Below are the GC graph samples taken on one RegionServer during the PE test run. We can clearly notice that with the changes in HBASE-11425, we are doing much less (better) GC.
MultiGets – without HBASE-11425 (25 threads)
Multigets – with HBASE-11425(25 threads)
ScanRange10000 – without HBASE-11425 (20 threads)
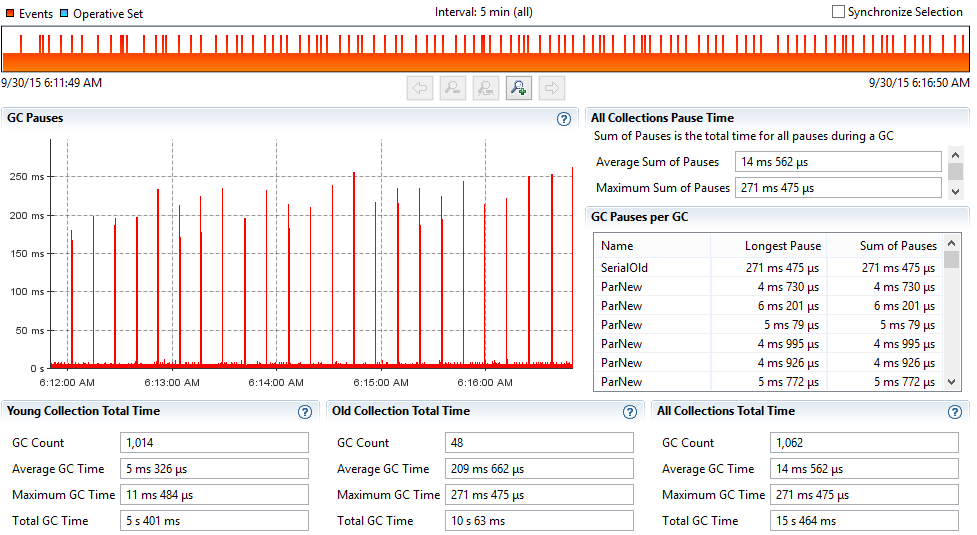
ScanRange10000 – with HBASE-11425 (20 threads)
Future Work
One implication of the findings above is that we should run with off heap Cache on always. We were reluctant to do this in the past when reads from the off heap cache took longer. This is no longer the case. We will look into making this option on by default. Also, this posting has described our conversion of the read pipeline to make it run with offheap buffers. Next up, naturally, would be making the write pipeline offheap.
Conclusion
Some parts of this work made it into branch-1 but to run with a fully off heap read path, you will have to wait on the HBase 2.0 release which should be available early next year (2016). Enabling L2 (BucketCache) in off heap mode will automatically turn on the off heap mechanisms described above. We hope you enjoy these improvements made to the Apache HBase read path.