Introduction "hbtop", a real-time monitoring tool for HBase modeled after Unix's 'top' command
by Toshihiro Suzuki, HBase Committer
hbtop is a real-time monitoring tool for HBase modeled after Unix's _top_ command. It can display summary information as well as metrics per Region/Namespace/Table/RegionServer. With this tool, you can see metrics sorted by a selected field and filter the metrics to see only metrics you are interested in. Also, with the drill-down feature, you dig in on hot-spotting Regions.
hbtop (https://issues.apache.org/jira/browse/HBASE-11062) is available in the coming hbase 2.1.7, 2.2.2, and 2.3.0 releases and is being actively backported to branch-1.
Run hbtop with the following command:
$ hbase hbtop
In this case, the values of hbase.client.zookeeper.quorum and zookeeper.znode.parent in hbase-site.xml in the classpath or their default values are used to connect. Or, specify your own zookeeper quorum and znode parent as follows:
$ hbase hbtop -Dhbase.client.zookeeper.quorum= -Dzookeeper.znode.parent=
Run hbtop and you'll see something like the following:

The top screen consists of a summary and metrics section. In the summary section, you can see HBase Version, Cluster ID, The number of region servers, Region count, Average Cluster Load and Aggregated Request/s. In the metrics portion, you can see metrics per Region/Namespace/Table/RegionServer depending on the selected mode. The top screen is refreshed on a period – 3 seconds by default.
You can scroll the metric records in the metrics section.

Command line arguments
| Argument | Description |
|---|---|
| -d,--delay |
The refresh delay (in seconds); default is 3 seconds |
| -h,--help | Print usage; for help while the tool is running press h key |
| -m,--mode |
The mode |
You can change mode by pressing the m key in the top screen.
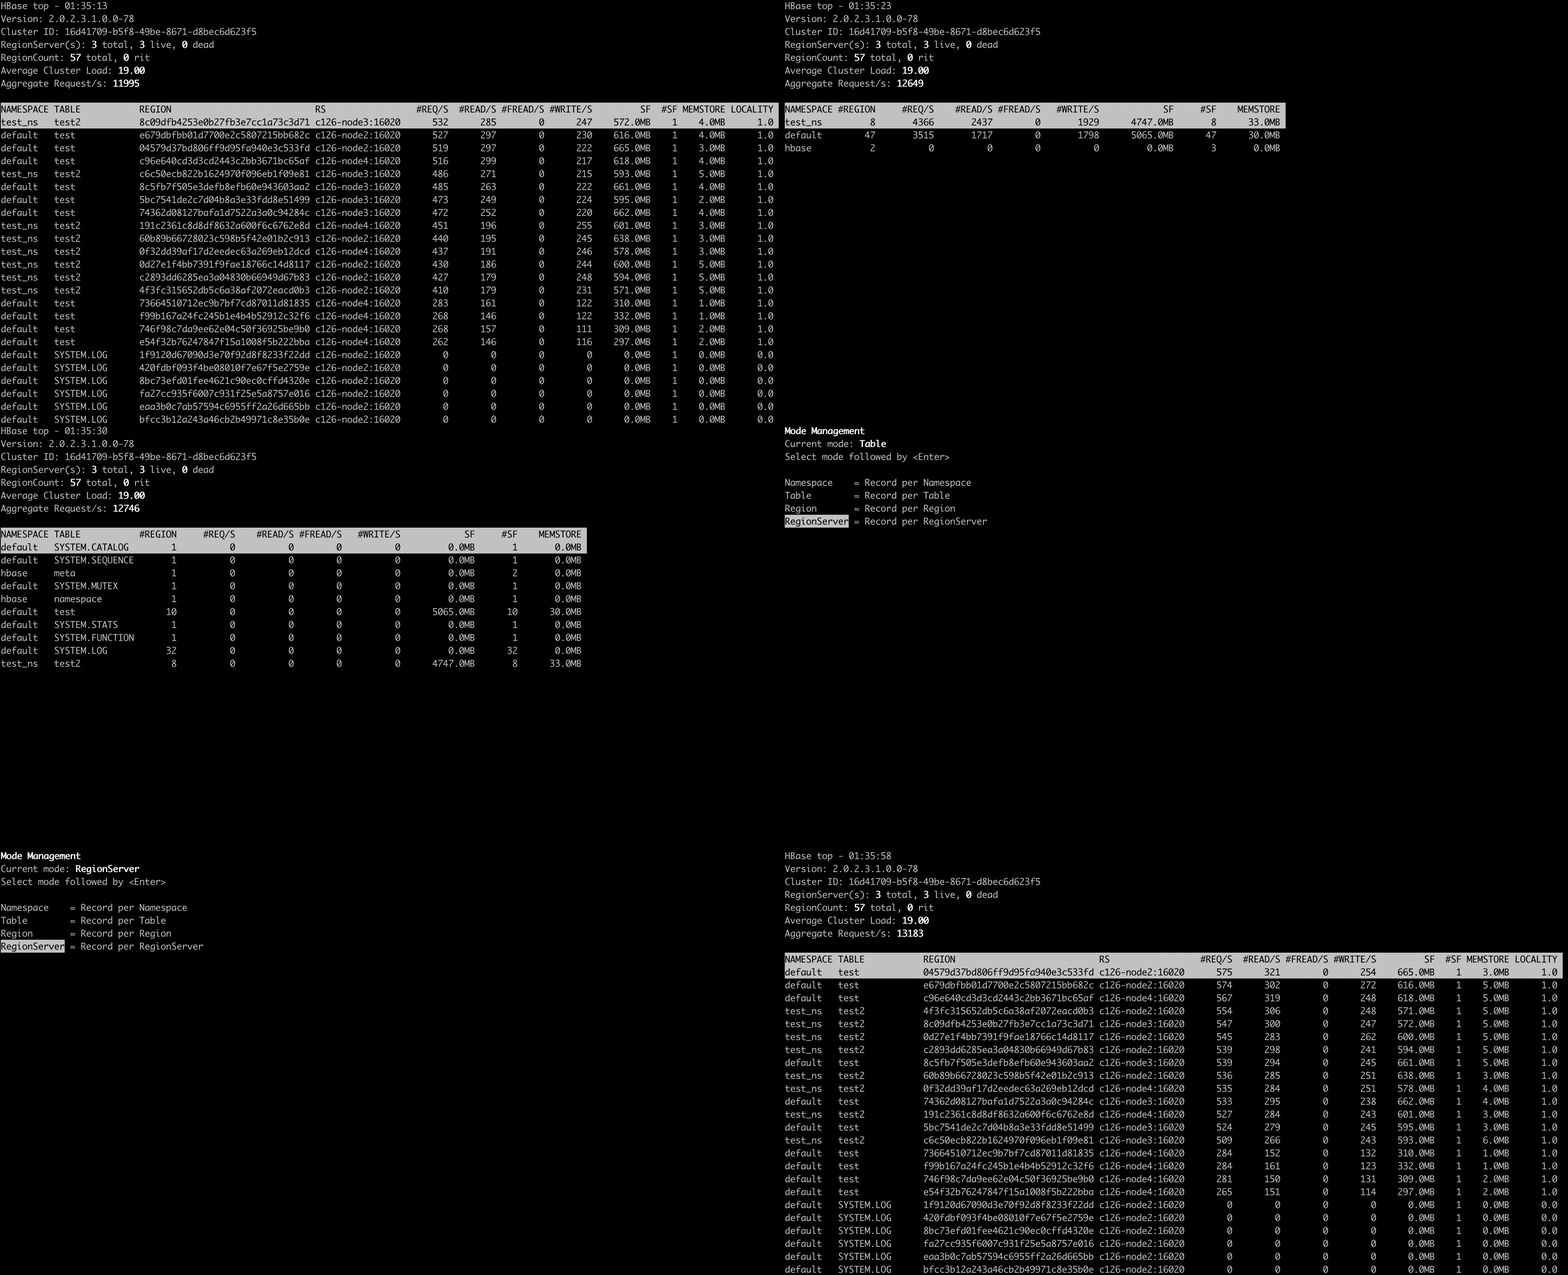
Change the refresh rate by pressing d key in the top screen.

You can change the field screen by pressing f key in the top screen. In the fields screen, you can change the displayed fields by choosing a field and pressing d key or space key.
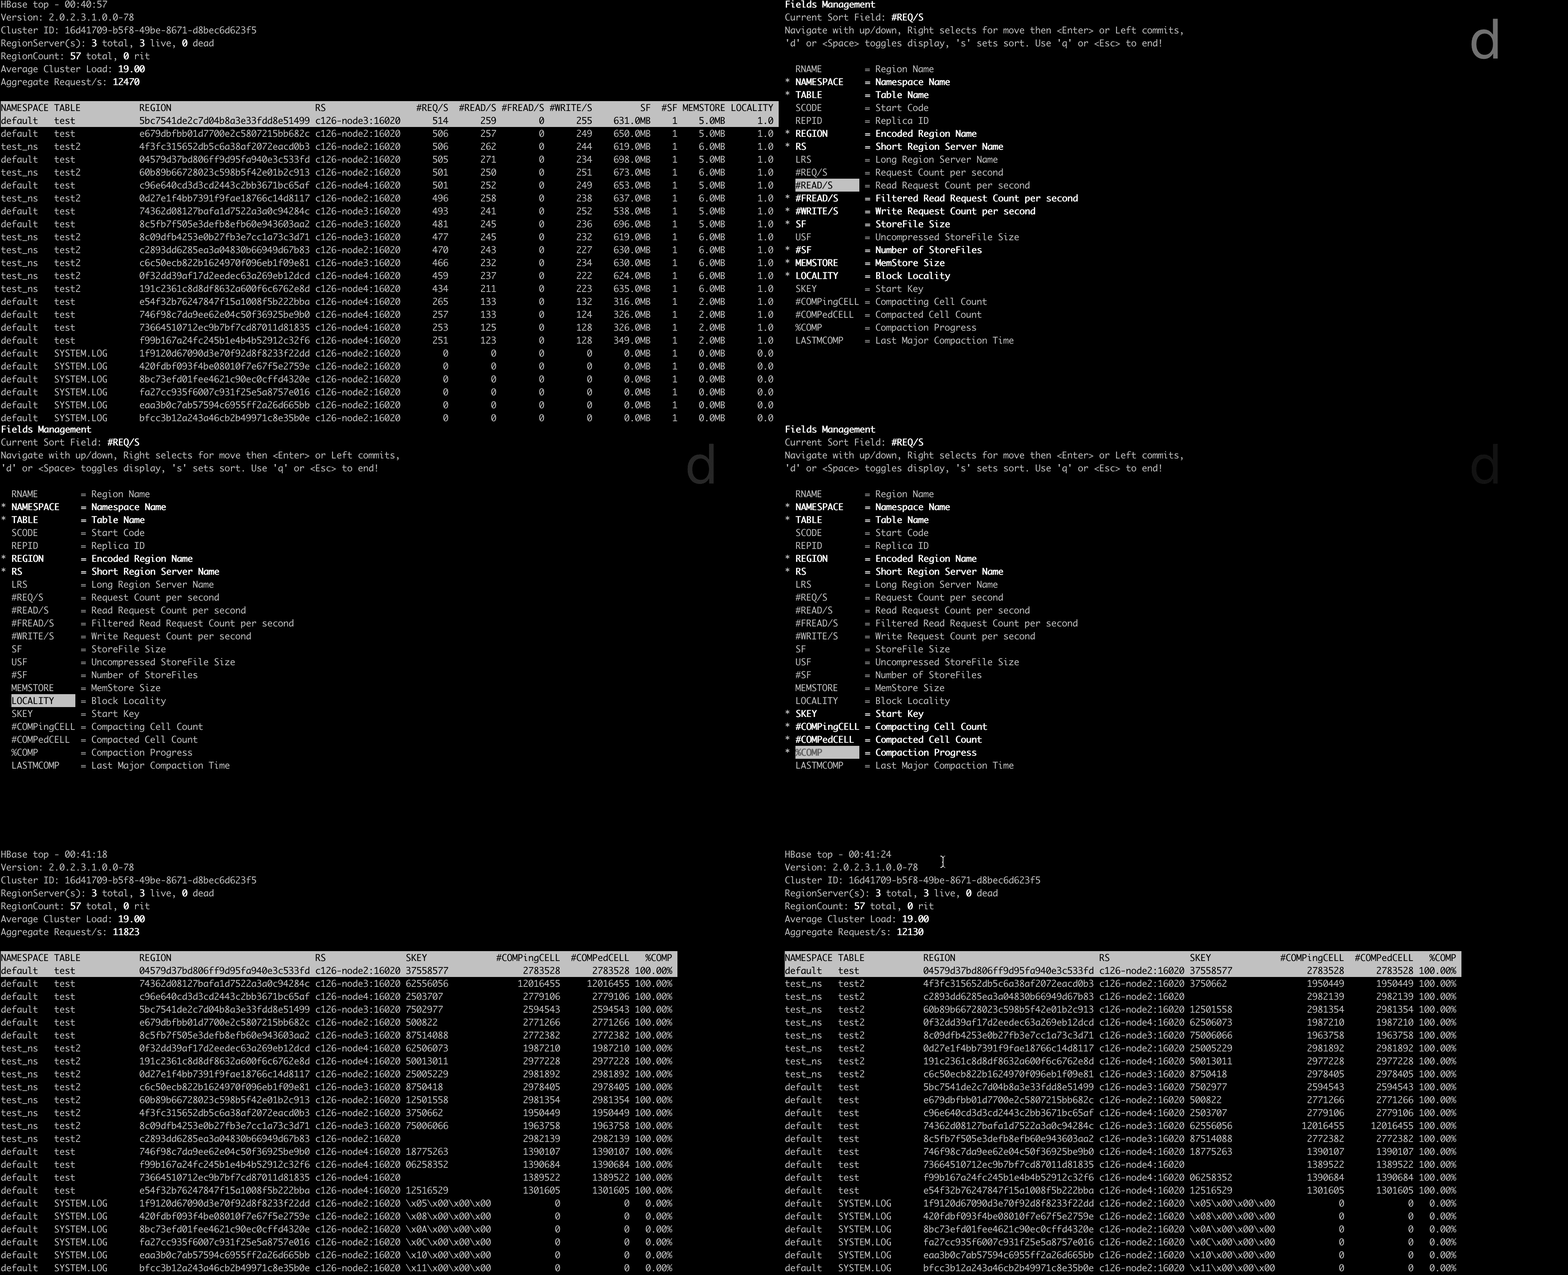
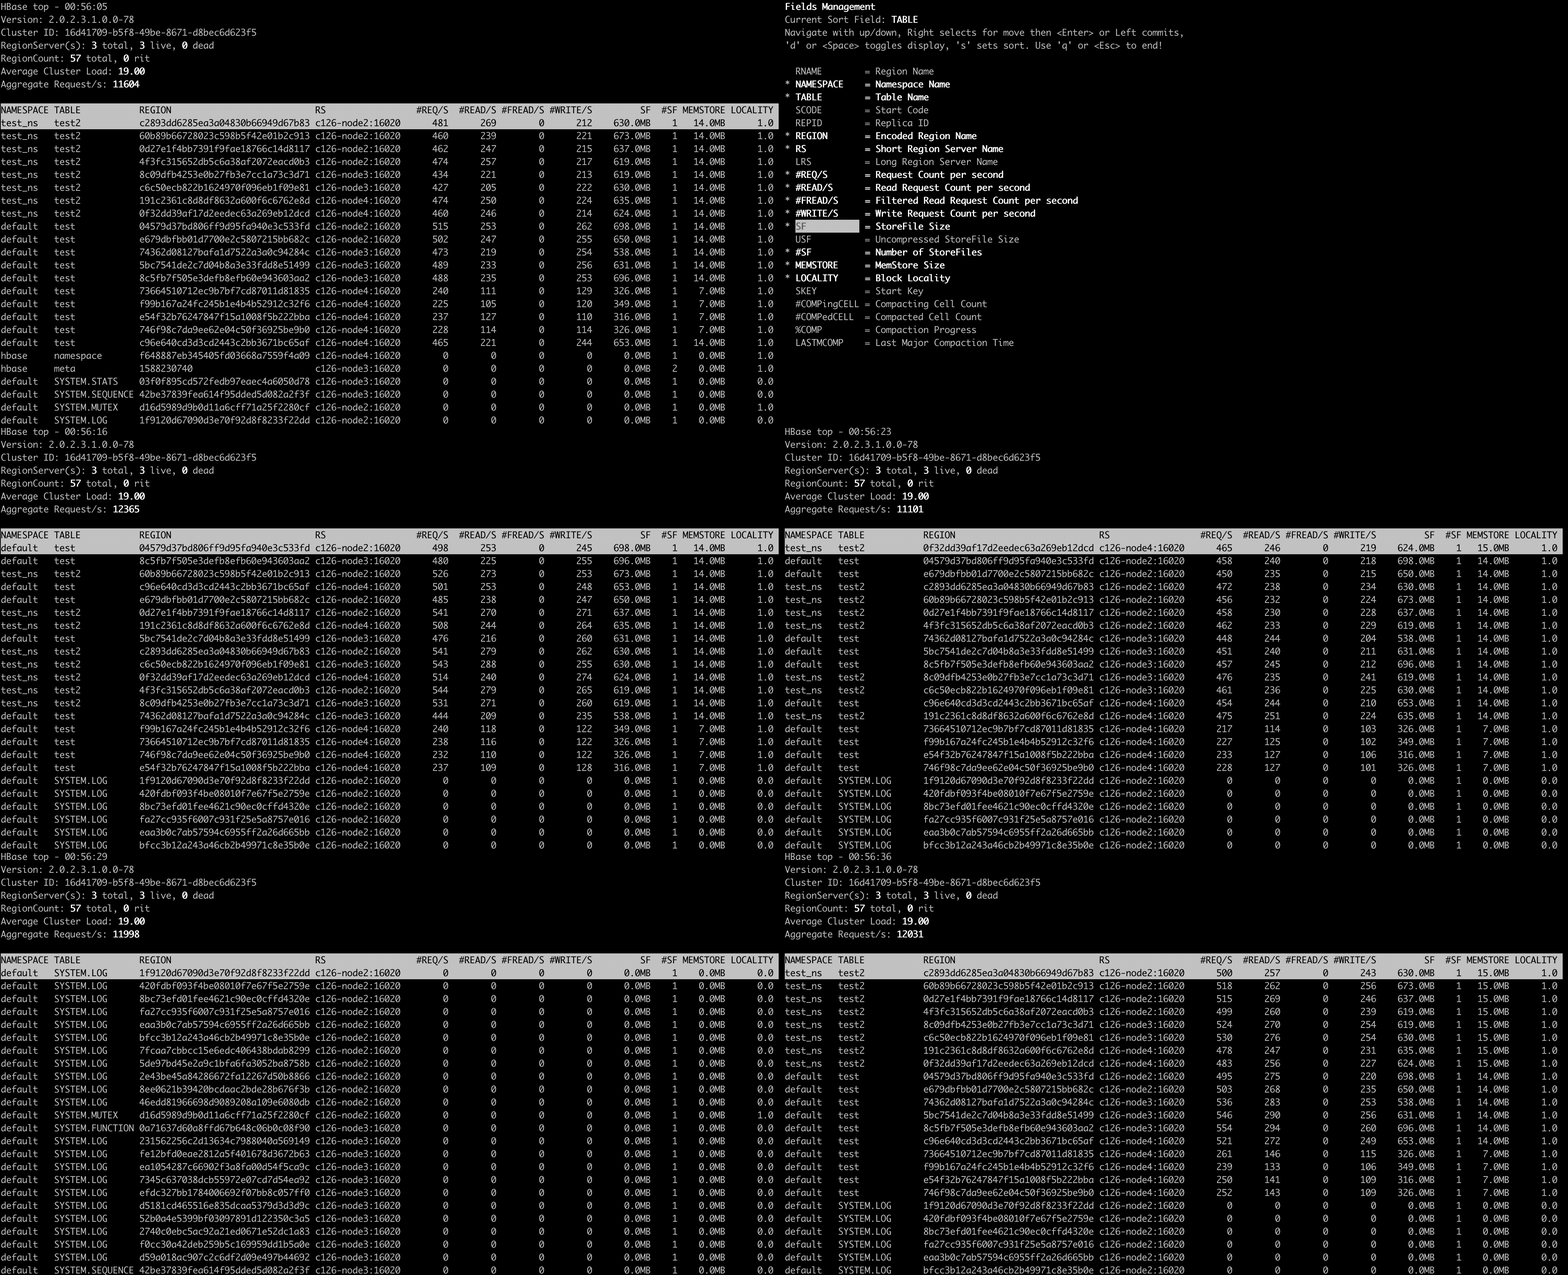
You can move to the fields screen by pressing f key in the top screen. In the field screen, you can change the sort field by choosing a field and pressing s key. Also, you can change the sort order (ascending or descending) by pressing R key.
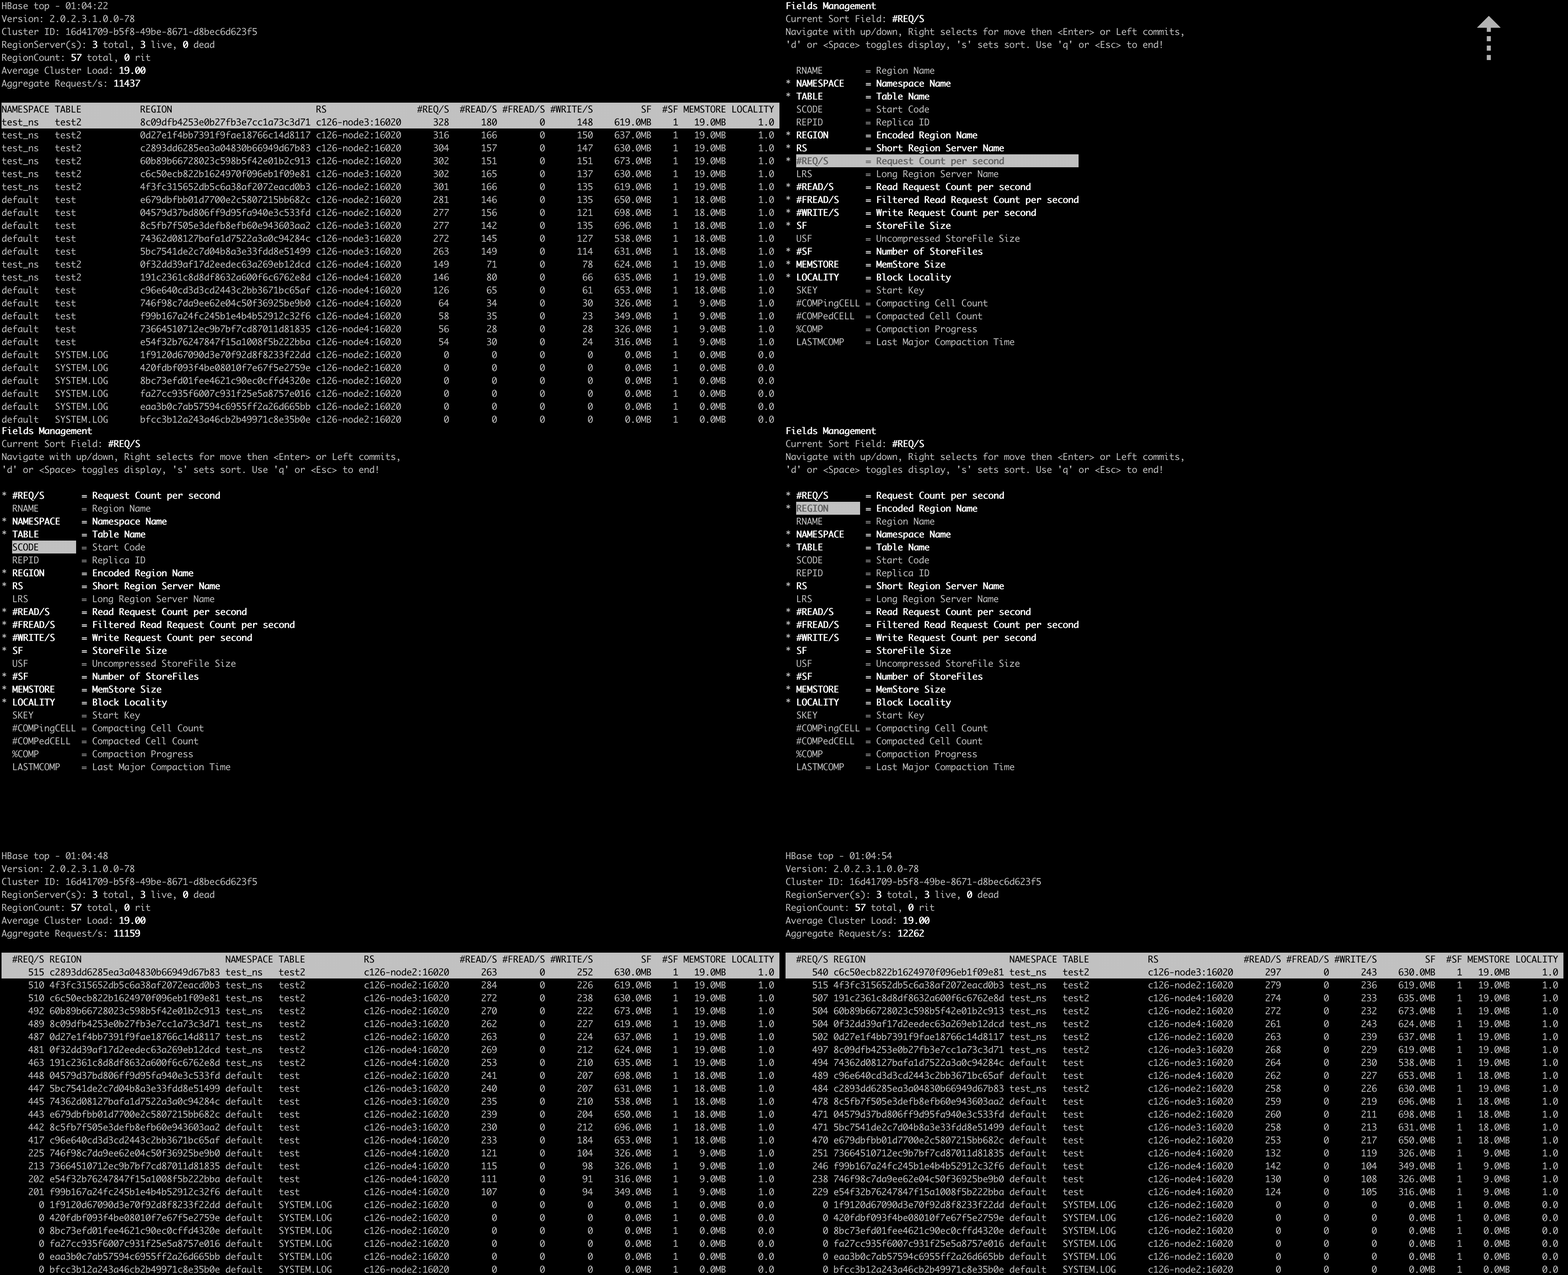
You can move to the fields screen by pressing f key in the top screen. In the field screen, you can change the order of the fields.
Filters
You can filter the metric records with the filter feature. We can add filters by pressing o key for ignoring case or O key for case sensitive.
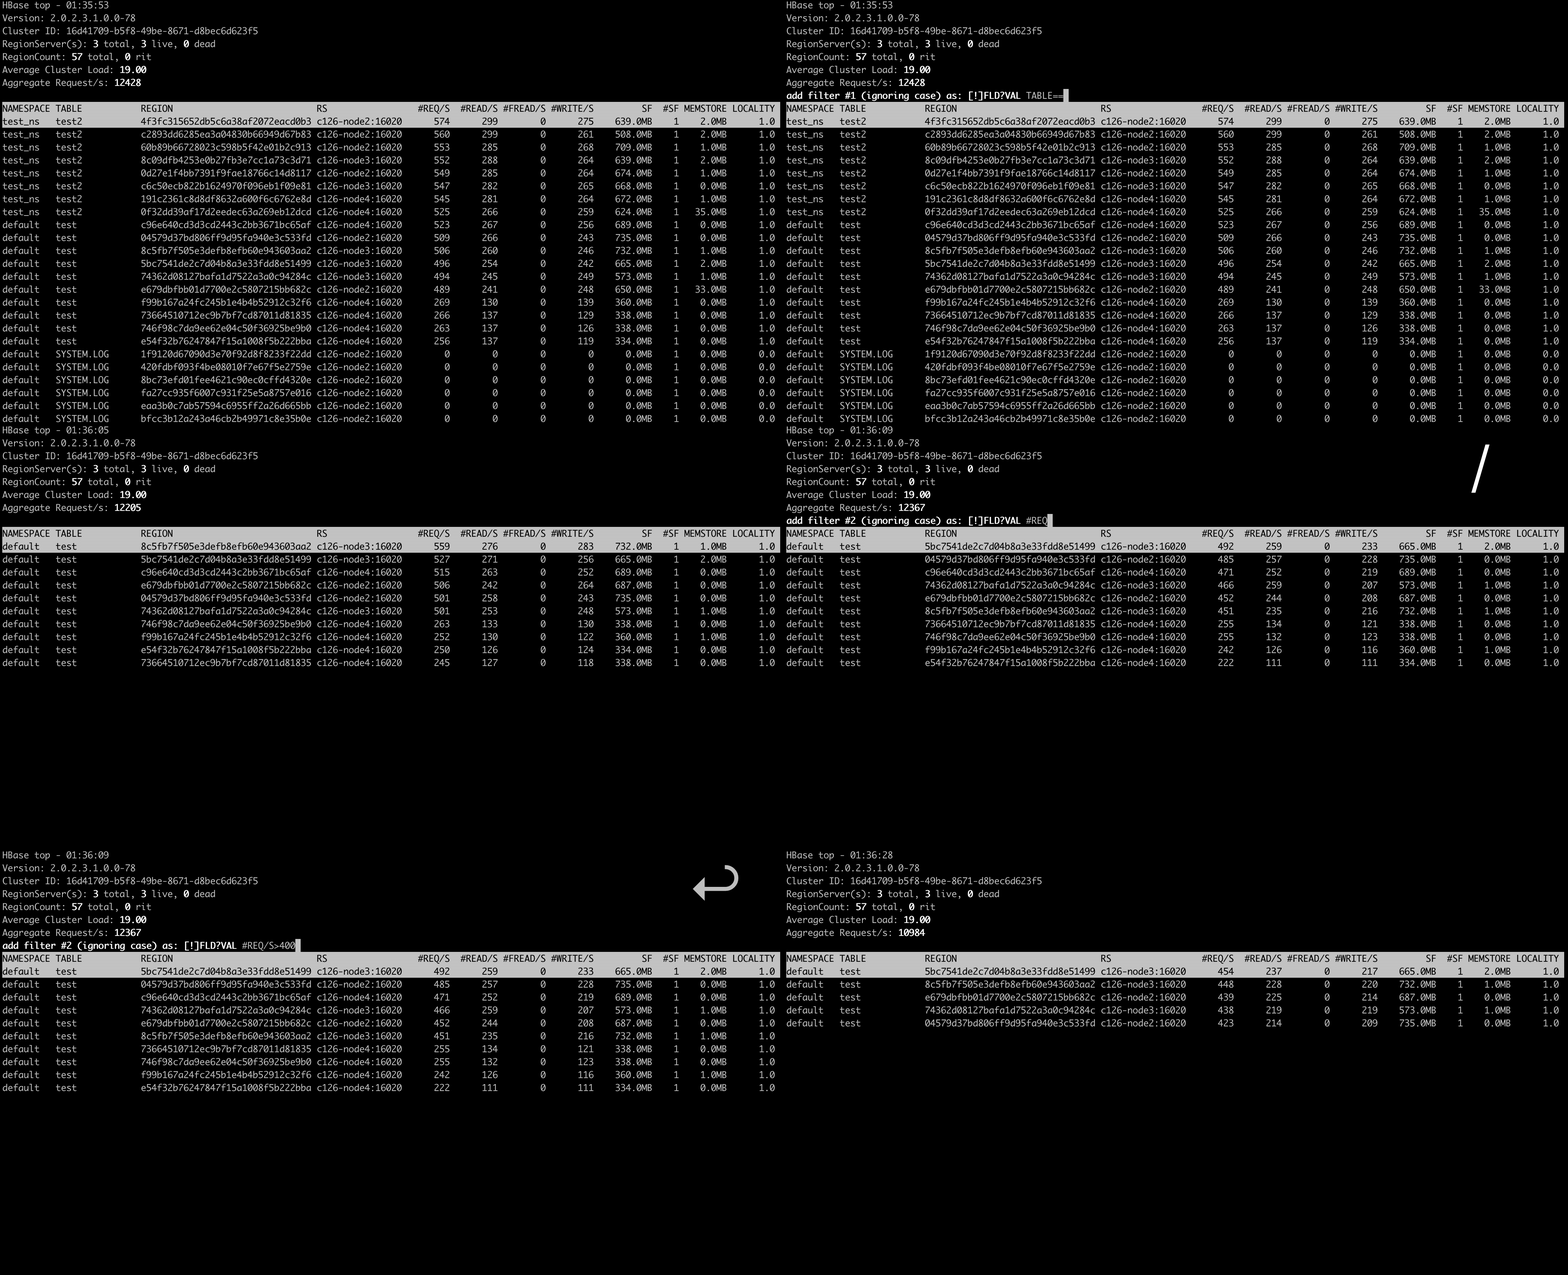
The syntax is as follows:
For example, we can add filters like the following:
NAMESPACE==default
REQ/S>1000
The operators you can specify are as follows:
| Operator | Description |
|---|---|
| = | Partial match |
| == | Exact match |
| > | Greater than |
| >= | Greater than or equal to |
| < | Less than |
| <= | Less than and equal to |
You can see the current filters by pressing ^o key and clear them by pressing = key.
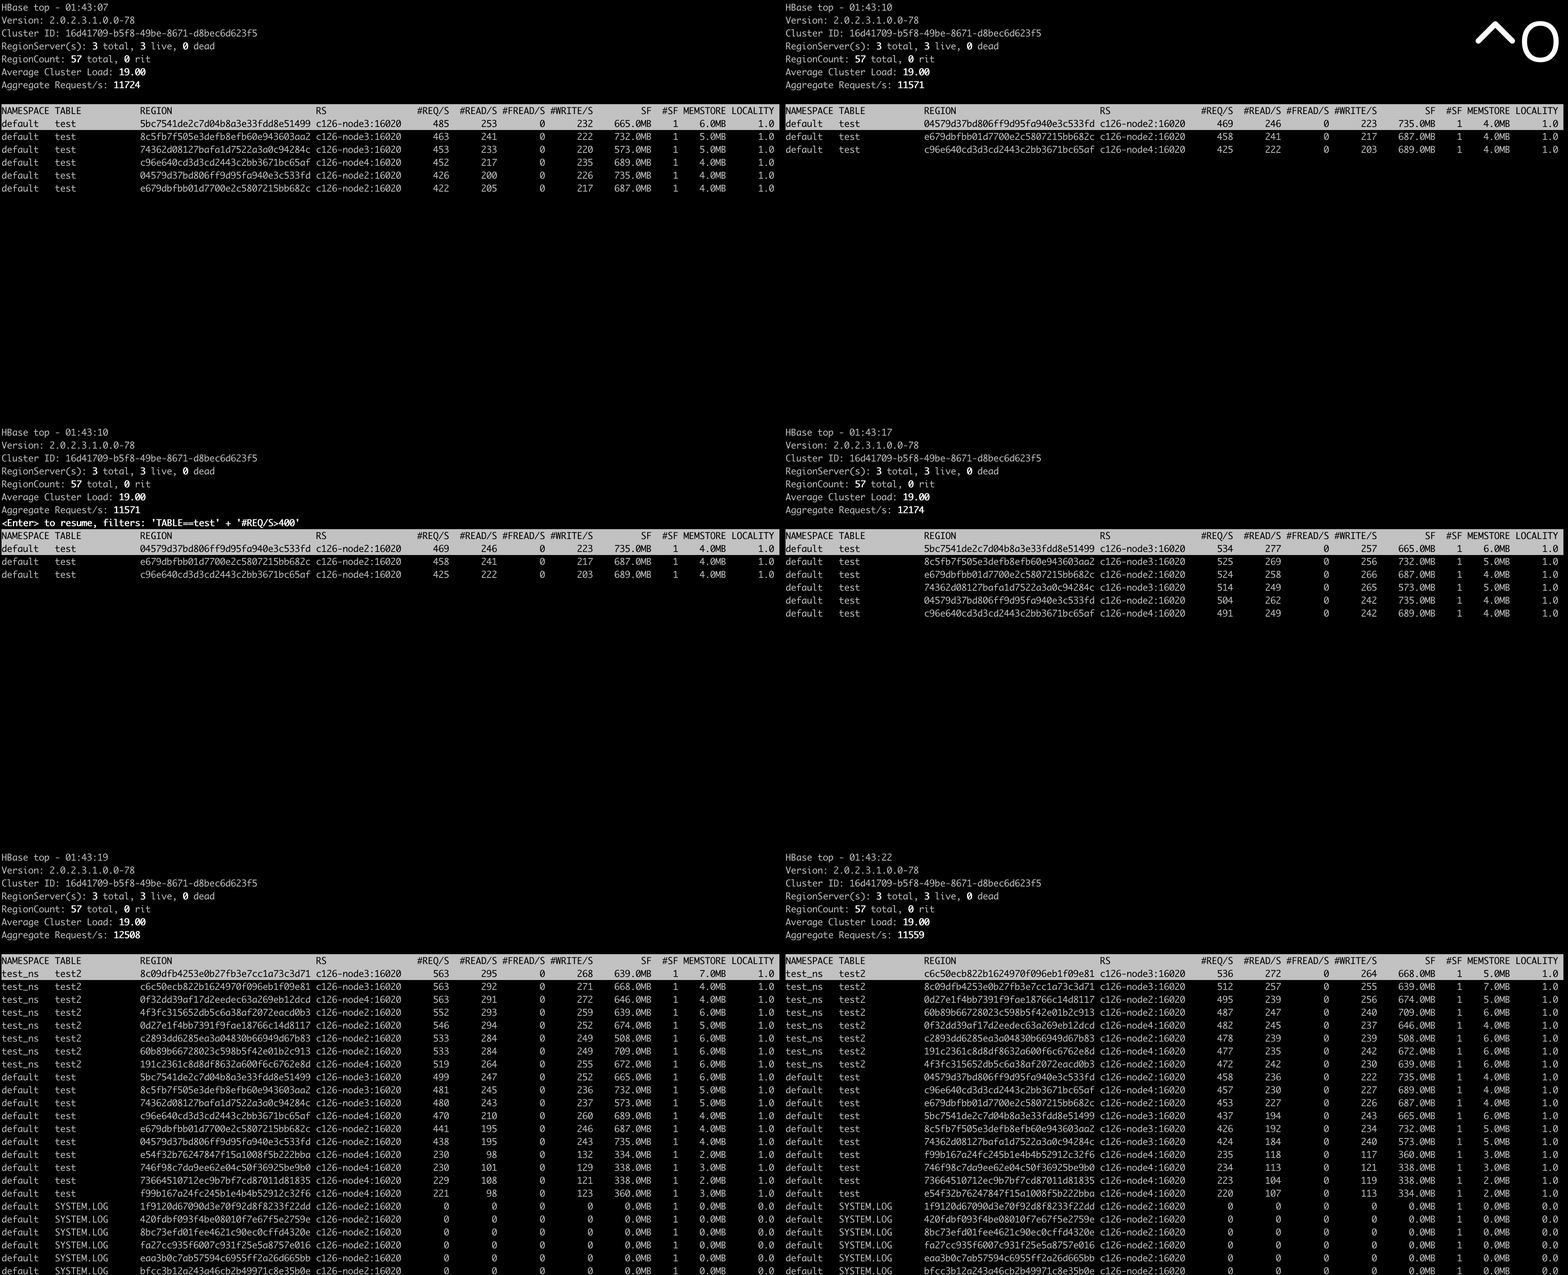
Drilling down
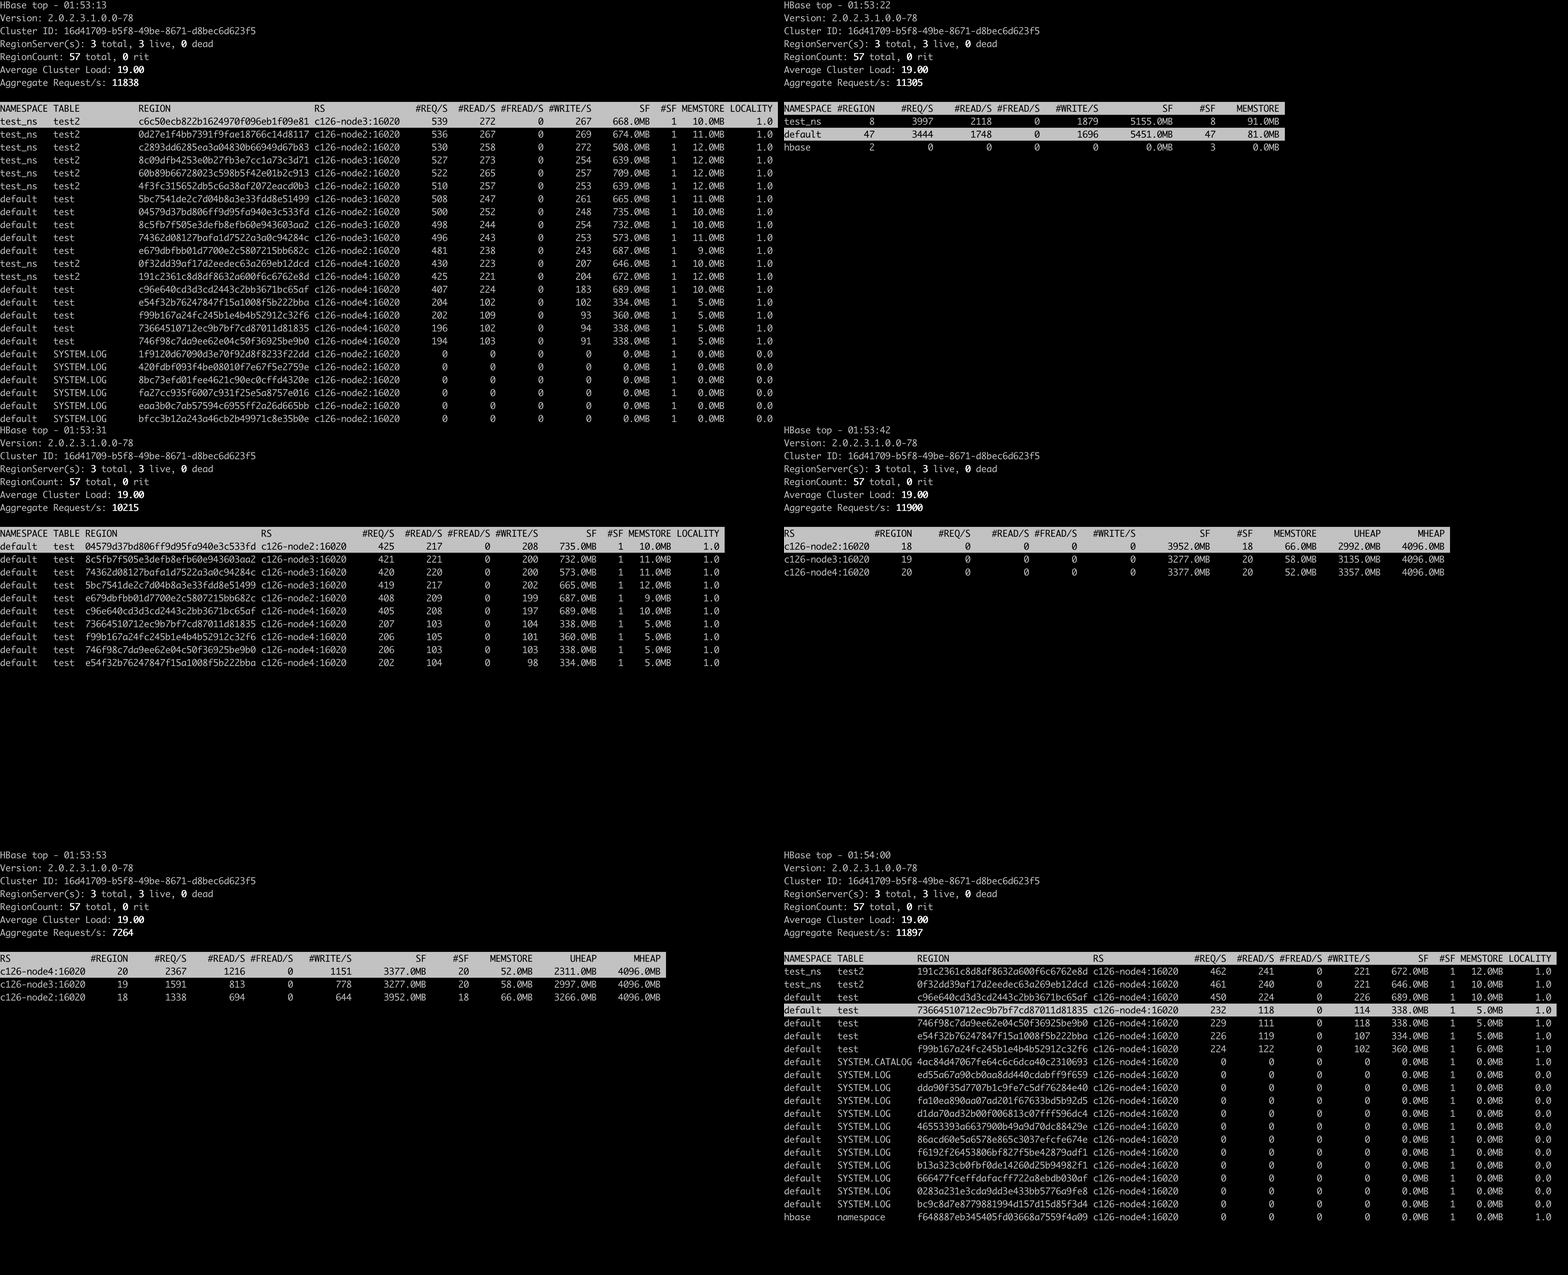
You can drill down on a metric record by pressing i key in the top screen. With this feature, you can find hot regions easily in a top-down manner.
Help screen
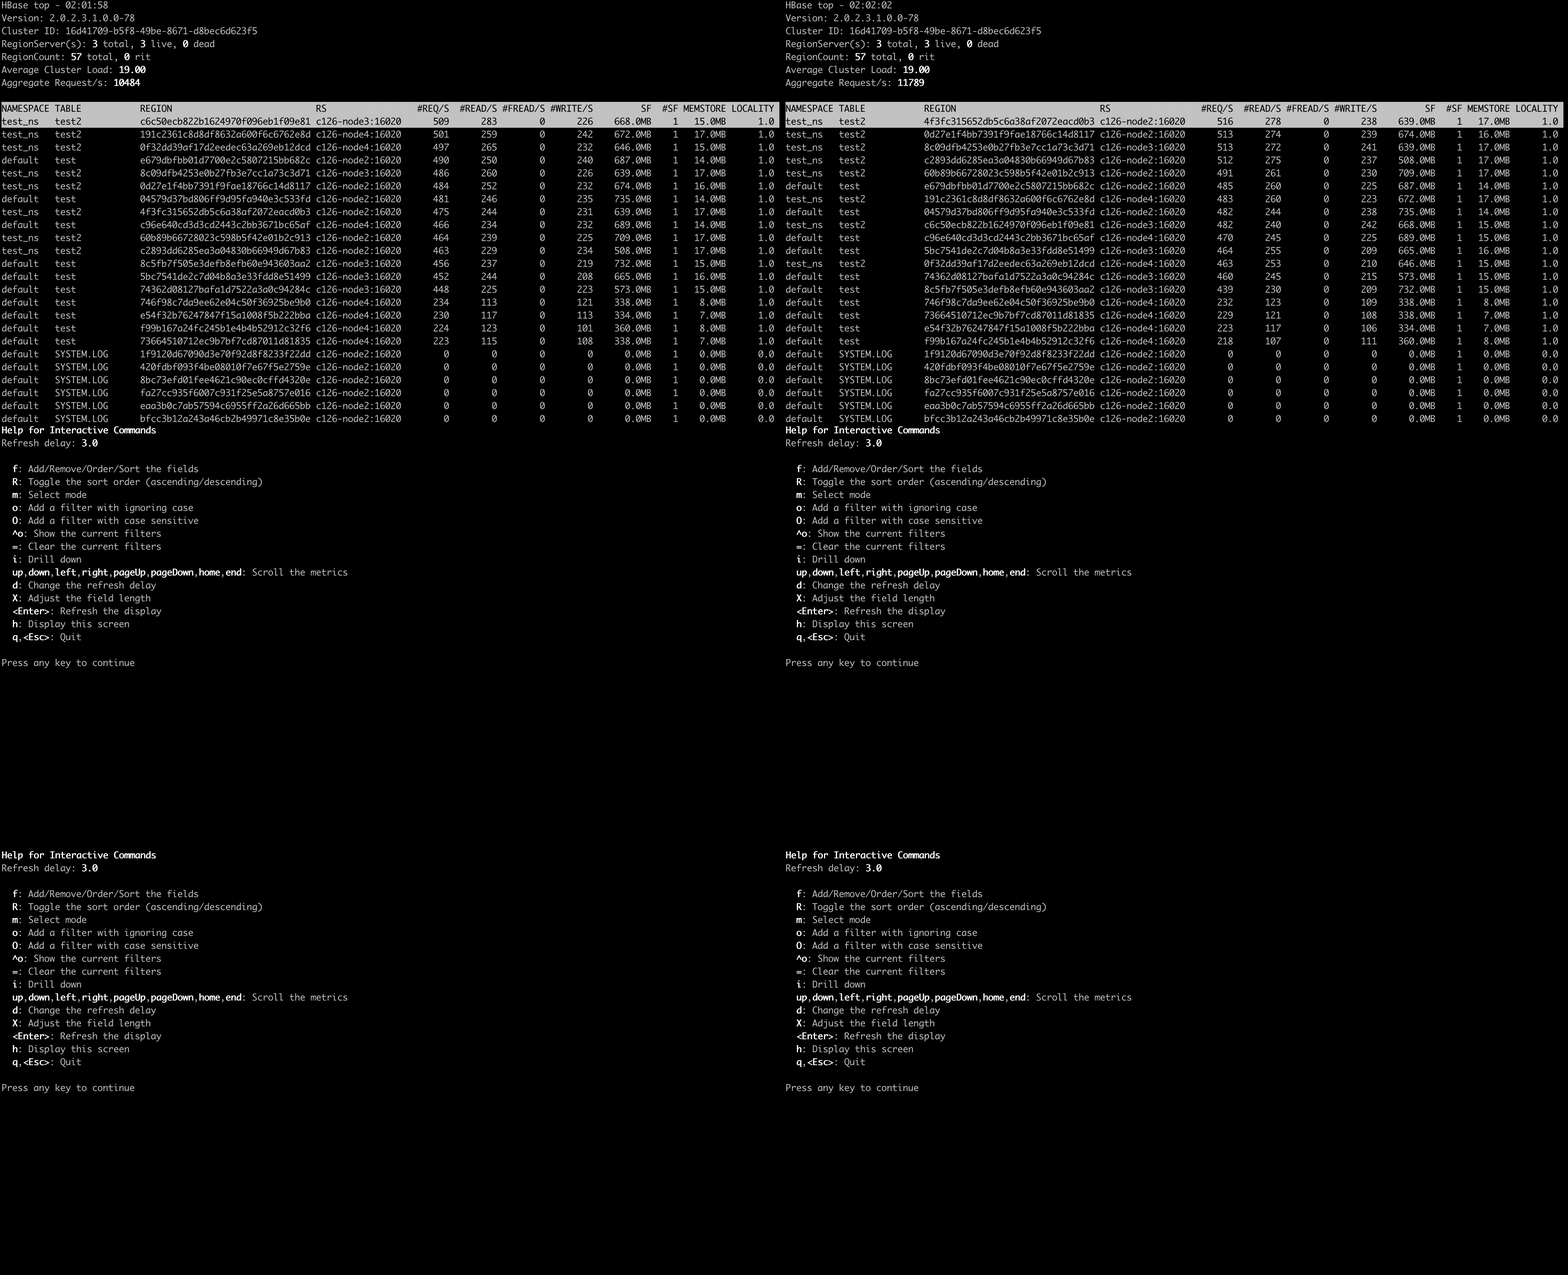
You can see the help screen by pressing h key in the top screen.
How hbtop gets the metrics data
hbtop gets the metrics from ClusterMetrics which is returned as the result of a call to Admin#getClusterMetrics() on the current HMaster. To add metrics to hbtop, they will need to be exposed via ClusterMetrics.
Feedback, bugs, and enhancements are all welcome!
The Reference Guide - hbtop: